

Tag Orbitals
Built a new way to see and explore a tag index.
Tags are not folders
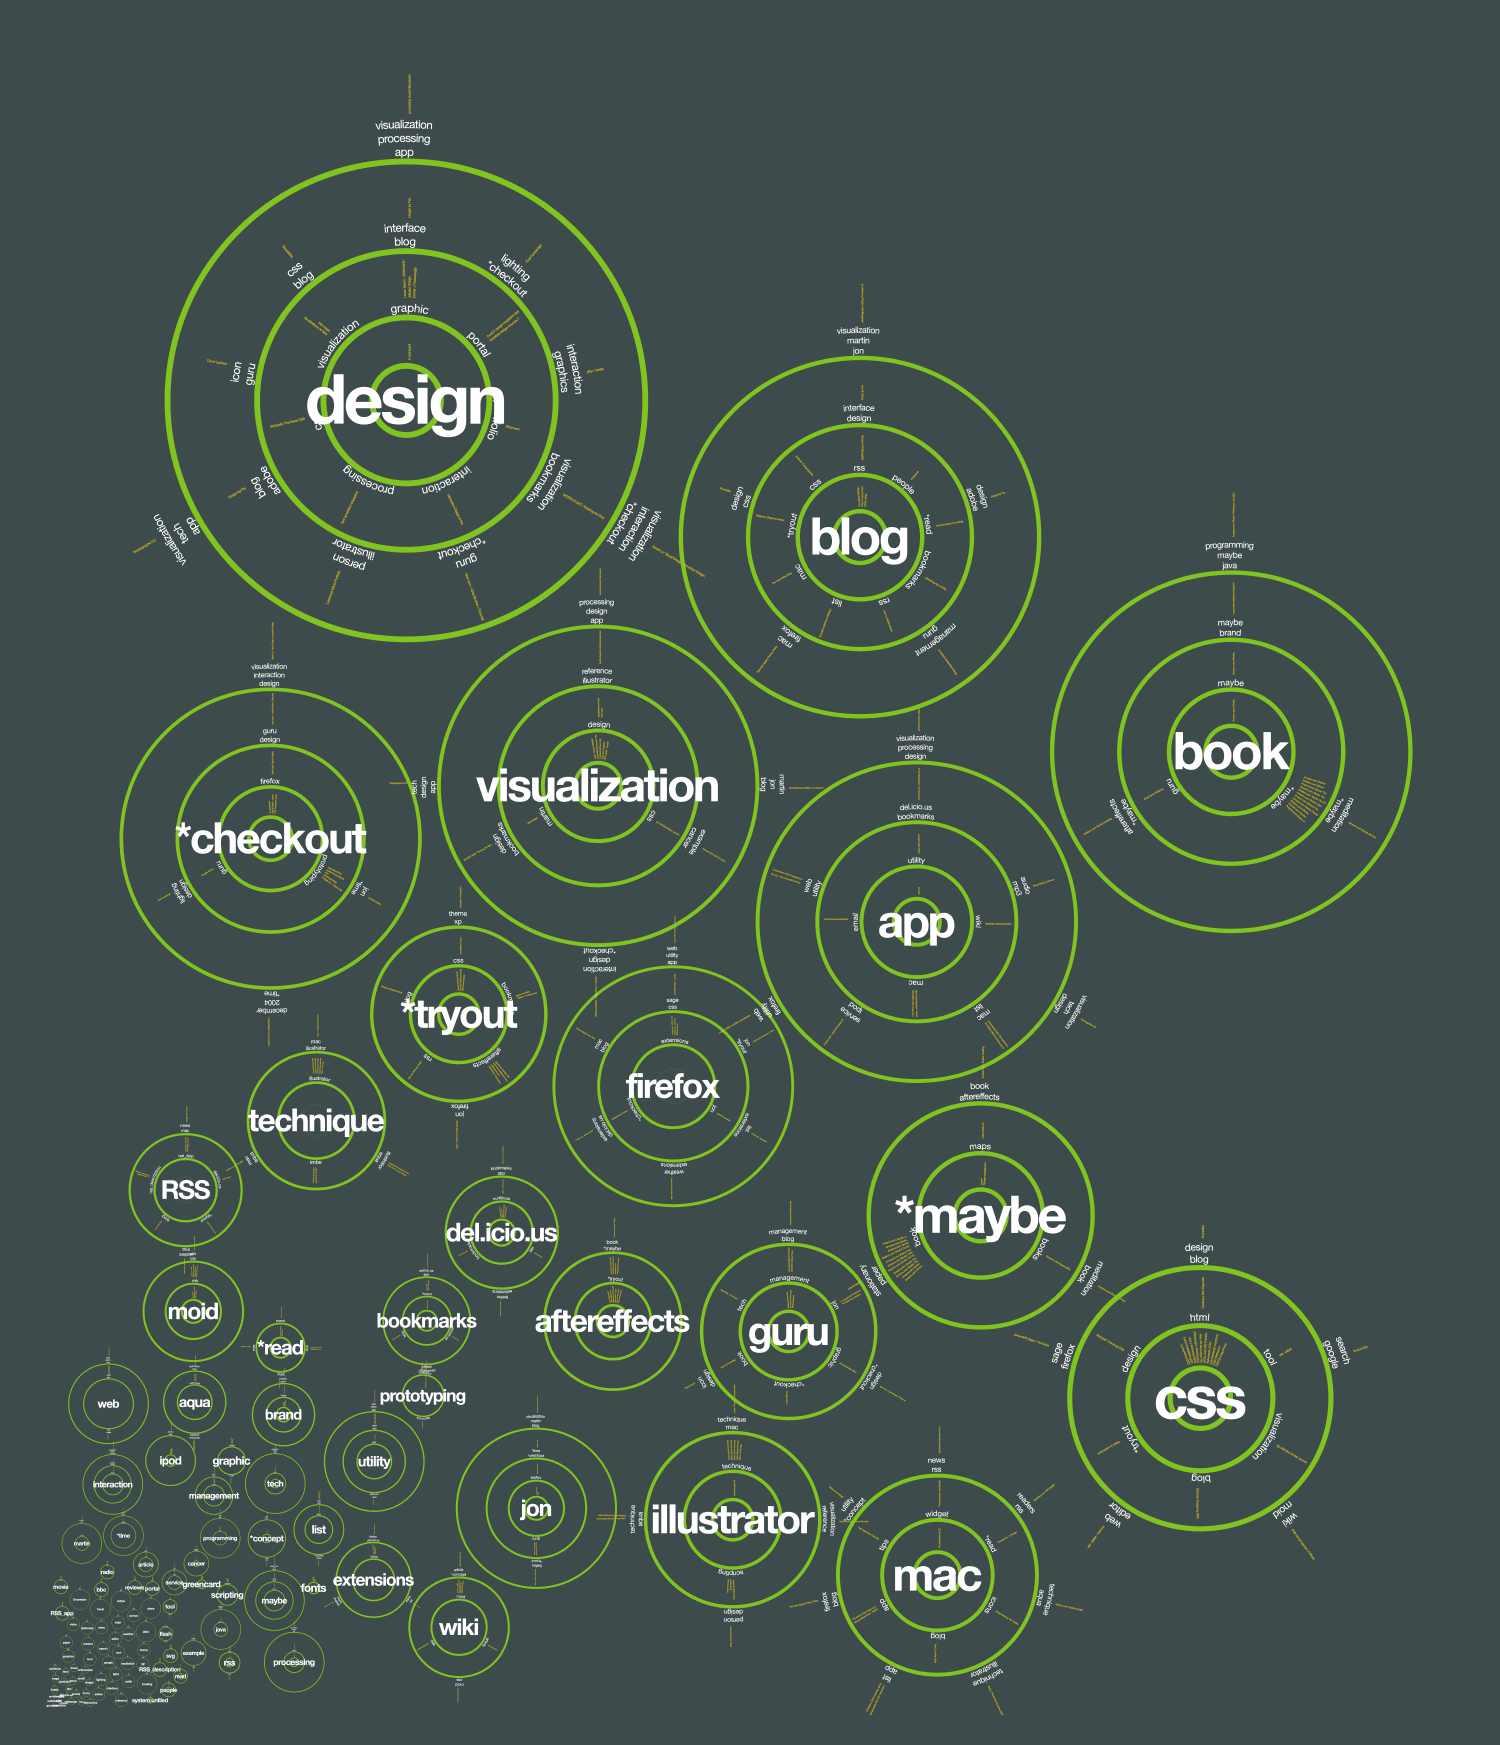
Folders follow the desktop metaphor which restrict content to only living in one location. Tags are more flexible, allowing content to be labeled in multiple ways. With the rise of tagging systems, it has become important to help users search and browse the index of tags that are created. Most visualization techniques rely on hard-to interpret network diagrams or focus only on a small subset of a collection. For example, TagClouds are compact but they sacrifice other important information such as relationships between tags. TagOrbitals allow you to display an entire index at once, while simultaneously showing details of individual tags along with other information, like tag relationships and clusters of interest. The data from a del.icio.us bookmark collection was used to illustrate this technique and was built with Abode Illustrator using Javascript.
Bohr atom model
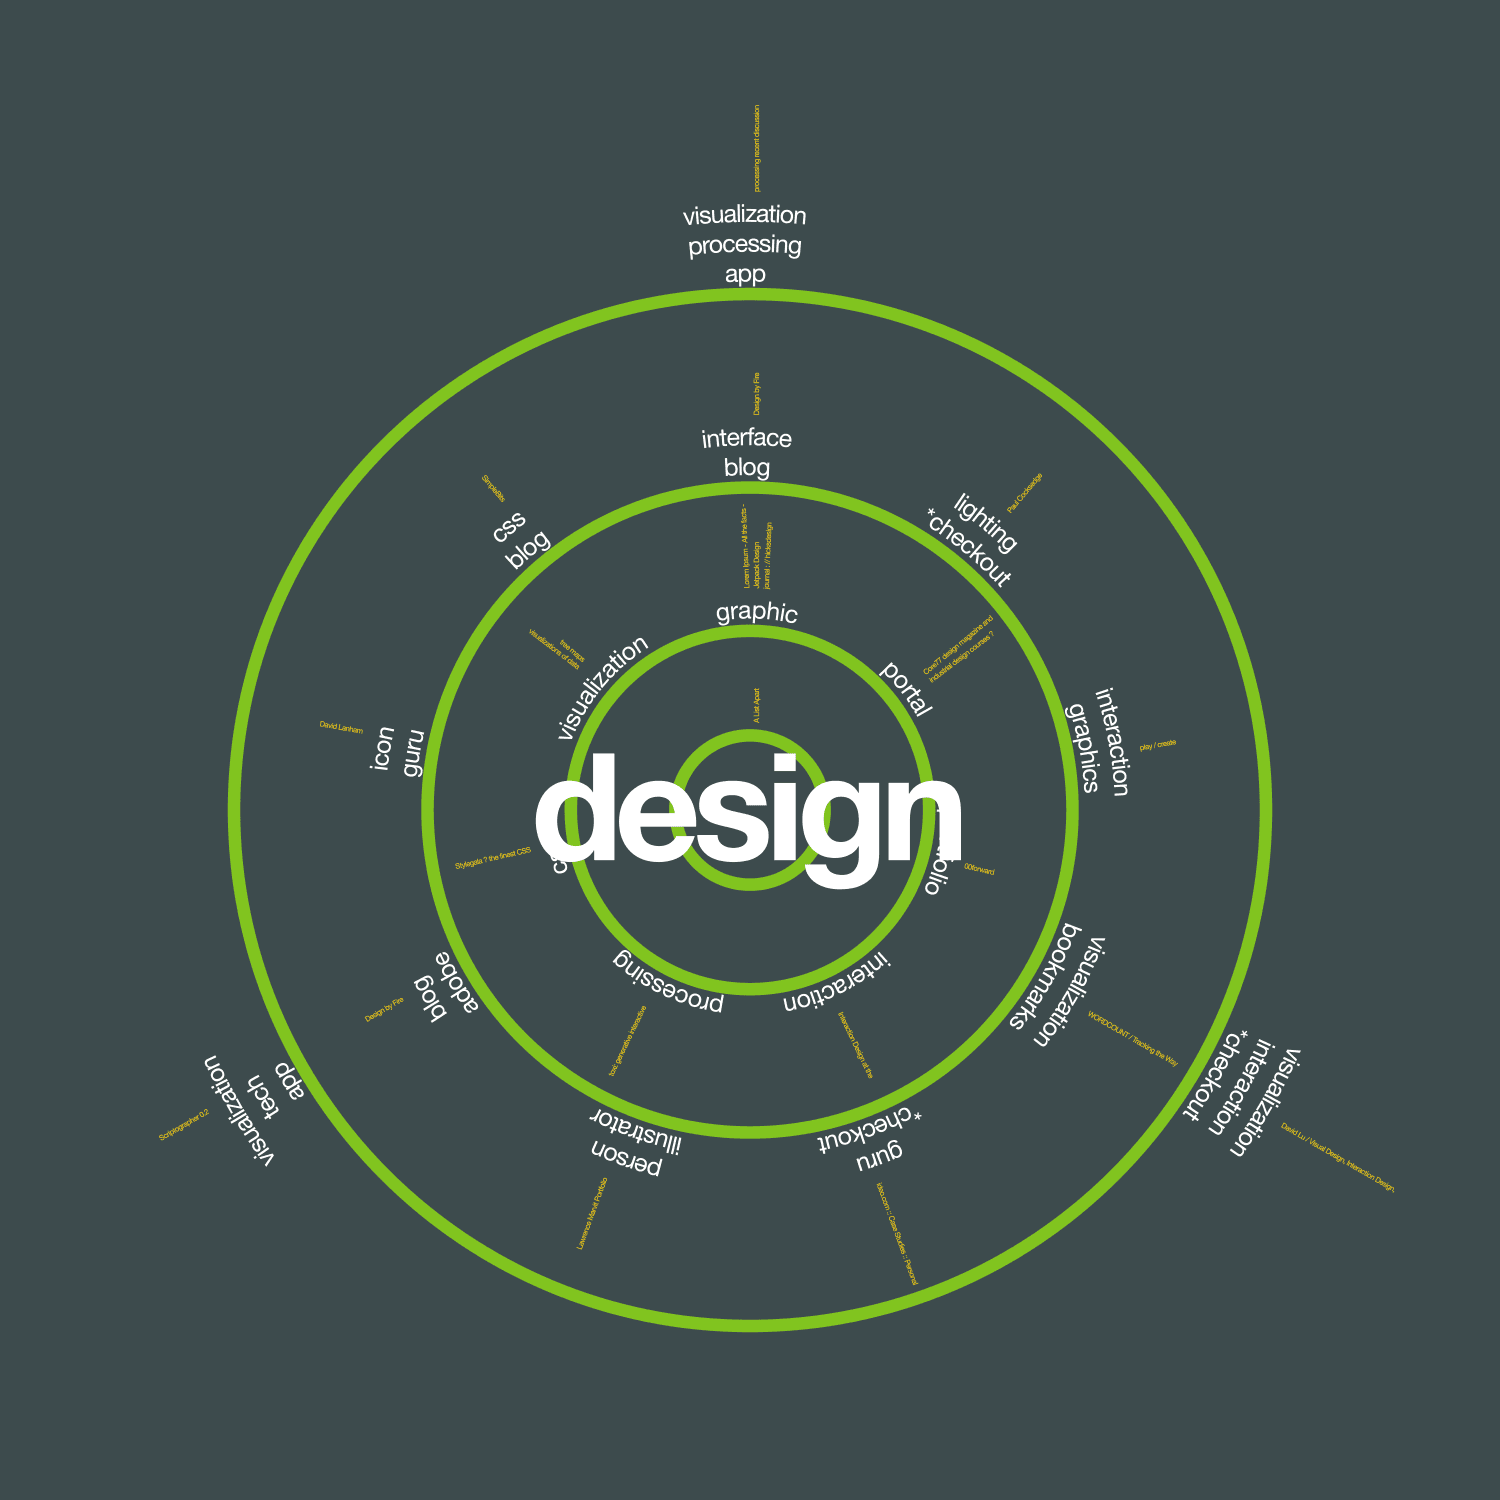
TagOrbitals are loosely based on the Bohr model of the atom. Each tag is placed in the center of a series of concentric circles. Every other tag that has been used in conjunction with the primary tag is placed in a surrounding orbit or green band. The first band shows all the tags that have been used solely with the primary tag.
The second band contains any set of two tags that have been used together with the primary tag, and so on. The title of each bookmark in the collection is drawn radially in orange beside each tag set on each band, so bookmarks that have been classified with the same set of tags have their titles sitting next to each other. Thus, it is easy to spot clusters of bookmarks like bookmarks tagged “design” and “graphic”. Each TagOrbital is scaled in proportion to the number of times that its primary tag has been used. The TagOrbitals are laid out with the smallest (least used tags) in the lower left corner and the largest (most used tags) in the upper right corner.
Data portrait
An individual user’s index constitutes a portrait of his use of the system, and can be examined and compared to other users. One can scan and zoom into each TagOrbital within the visualization and see the relationship between tags and the actual title of every bookmark within the collection. The number of bands within a TagOrbital shows the number of other tags that have been used with its primary tag at a glance.
Paper
This sketch was presented at Siggraph ACM 2006 TagOrbitals: a tag index visualization.