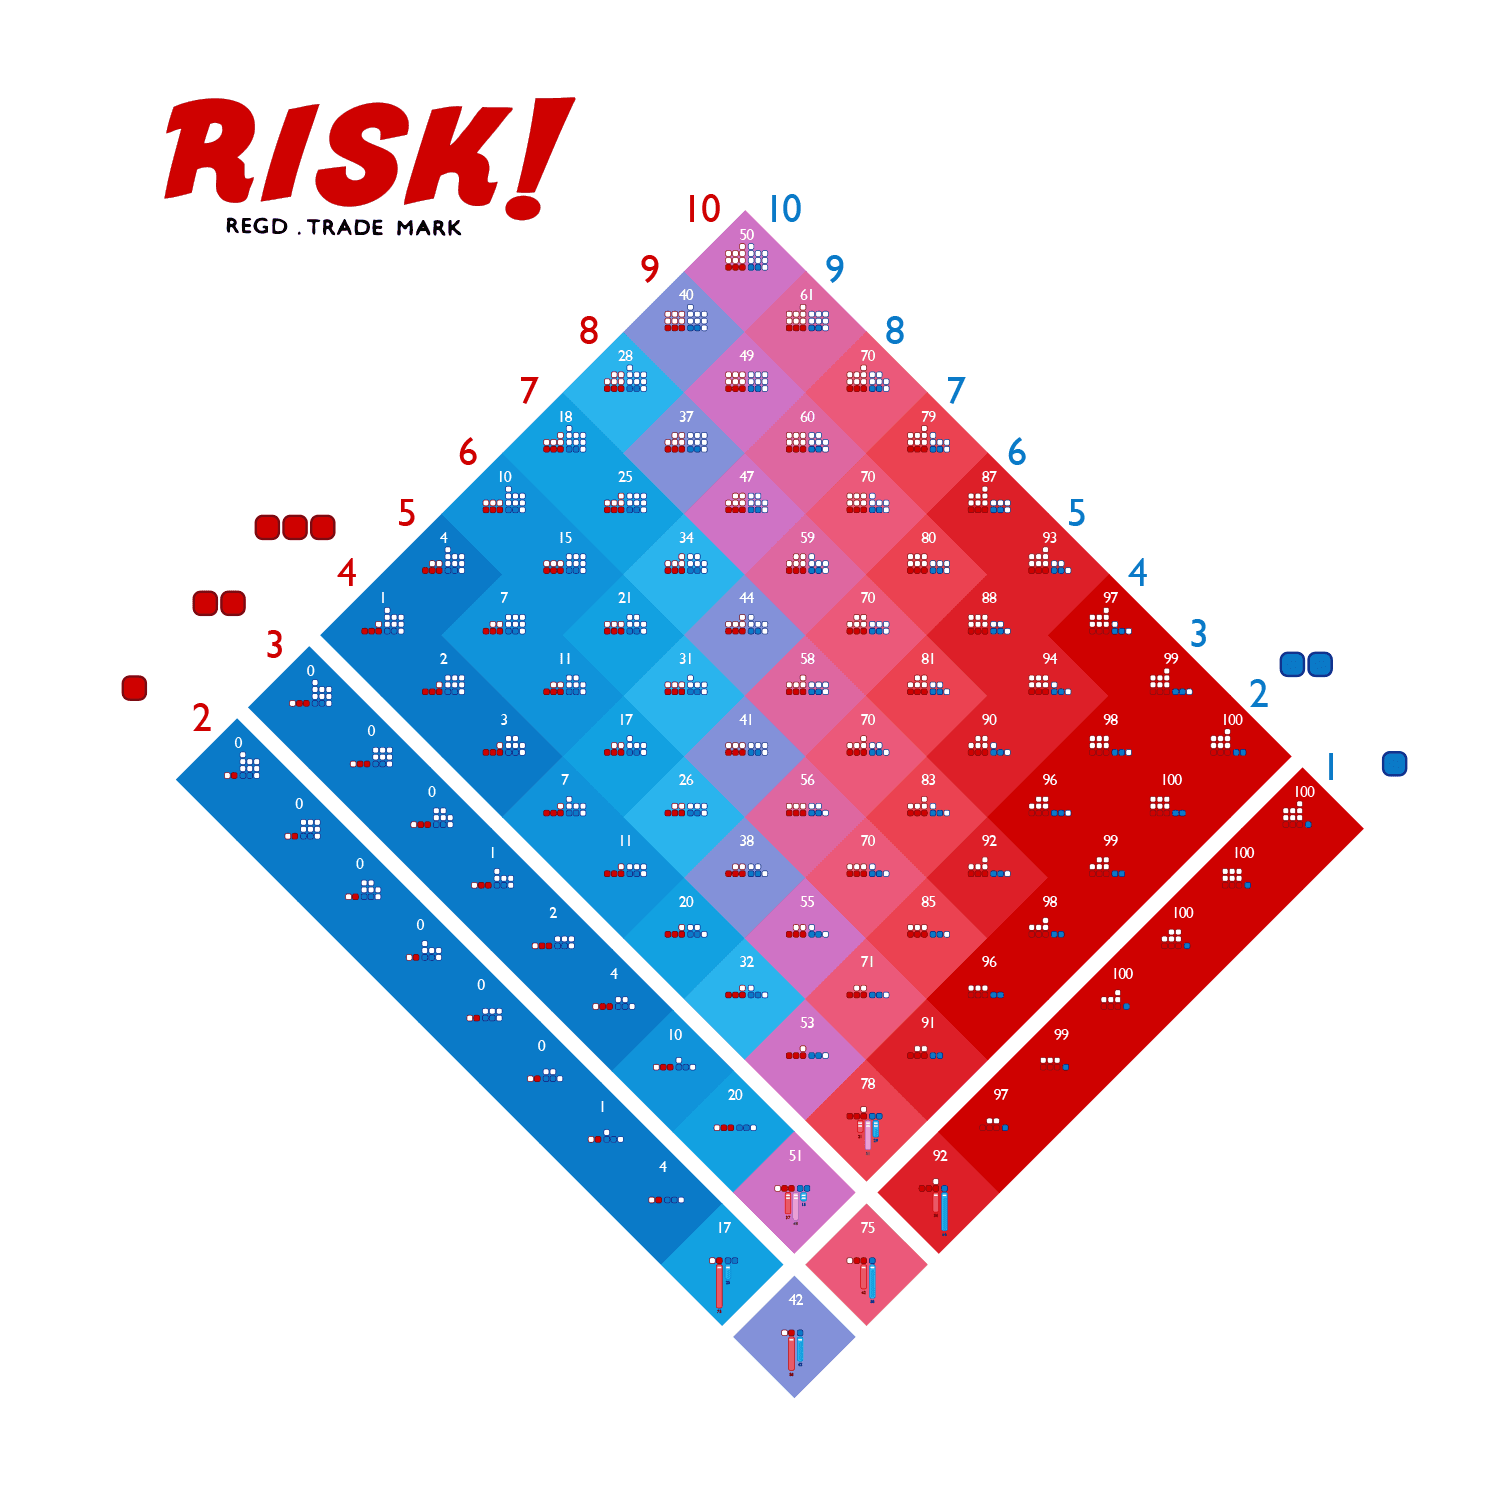
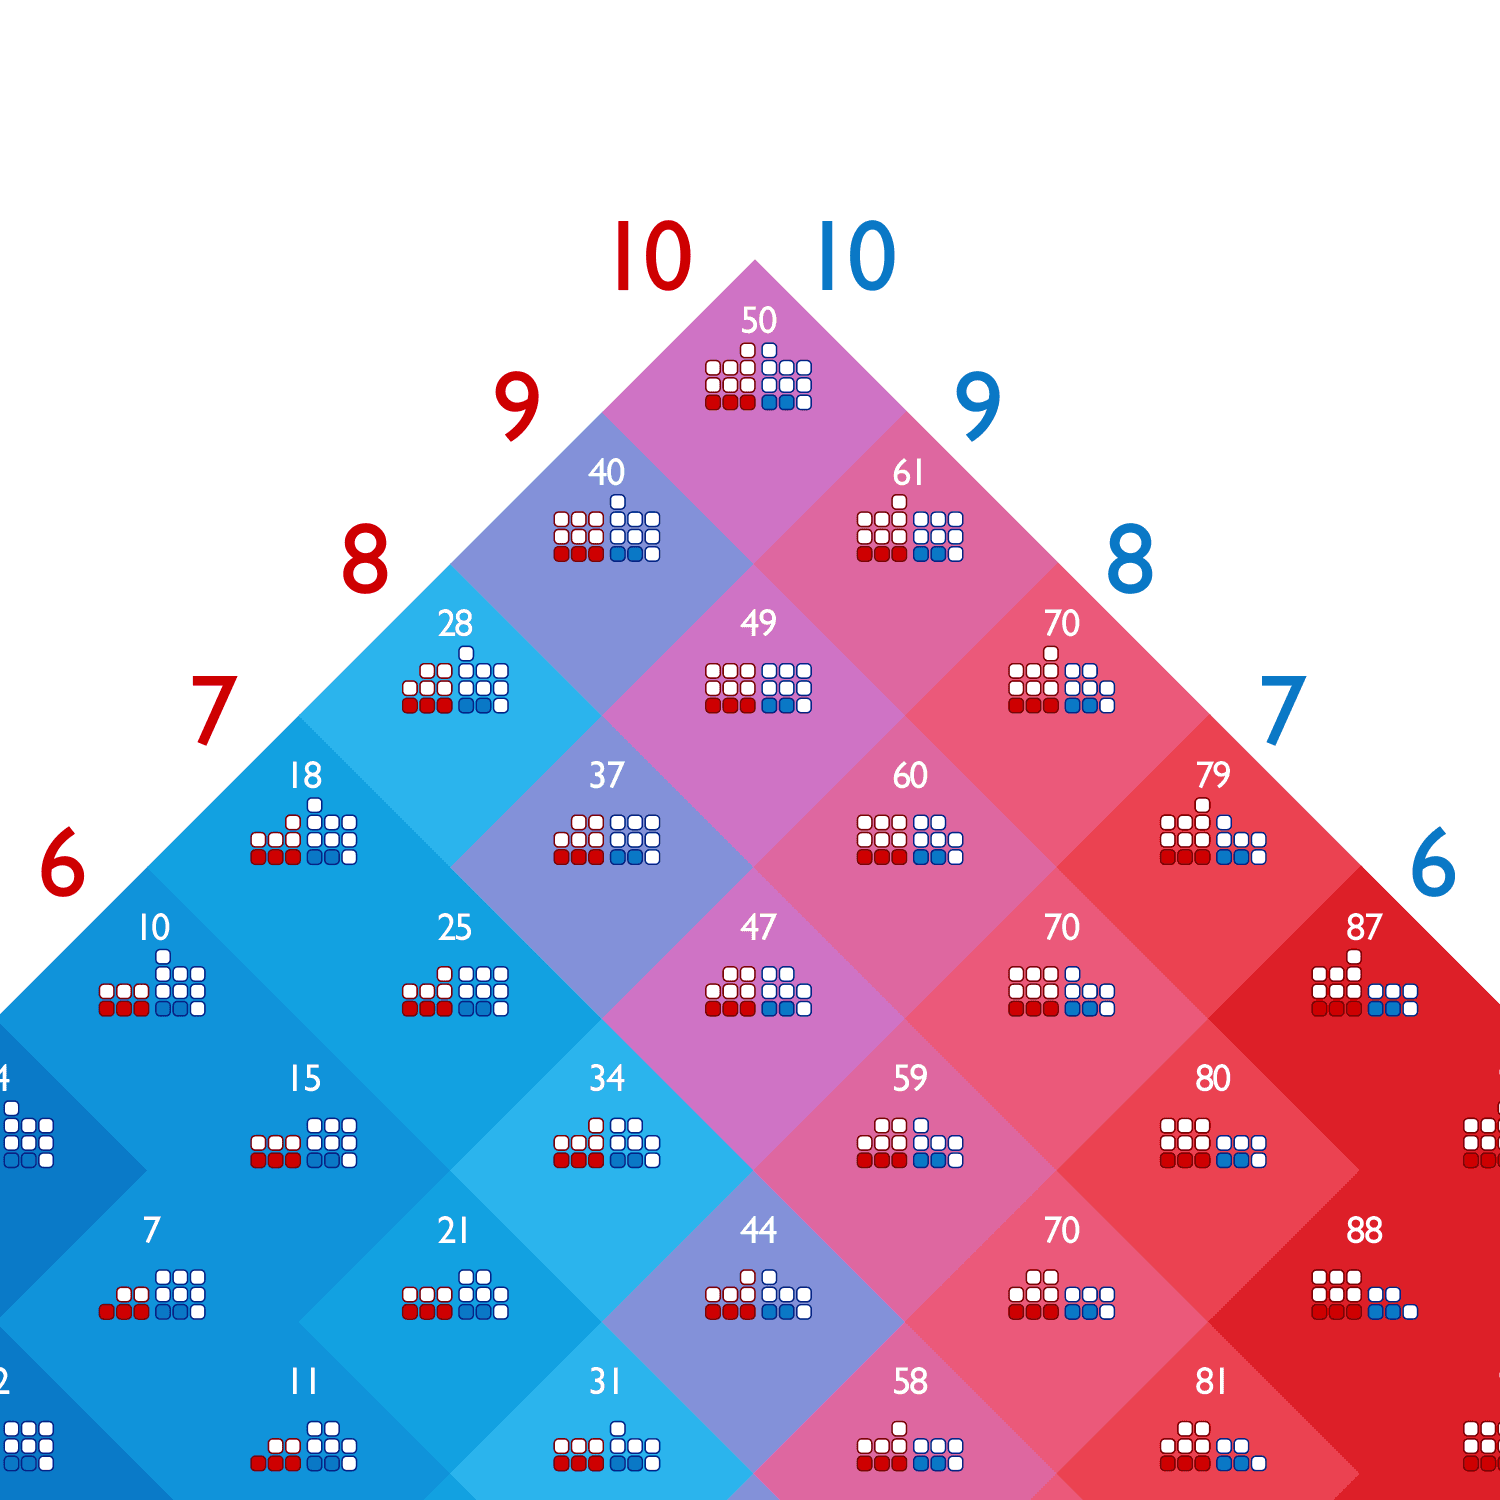
What are the odds of an attacker gaining a territory given the number of attacking units in red vs the number of defenders in blue? The answer is the white number at the top of each diamond. Click the image to see the visualization in detail.
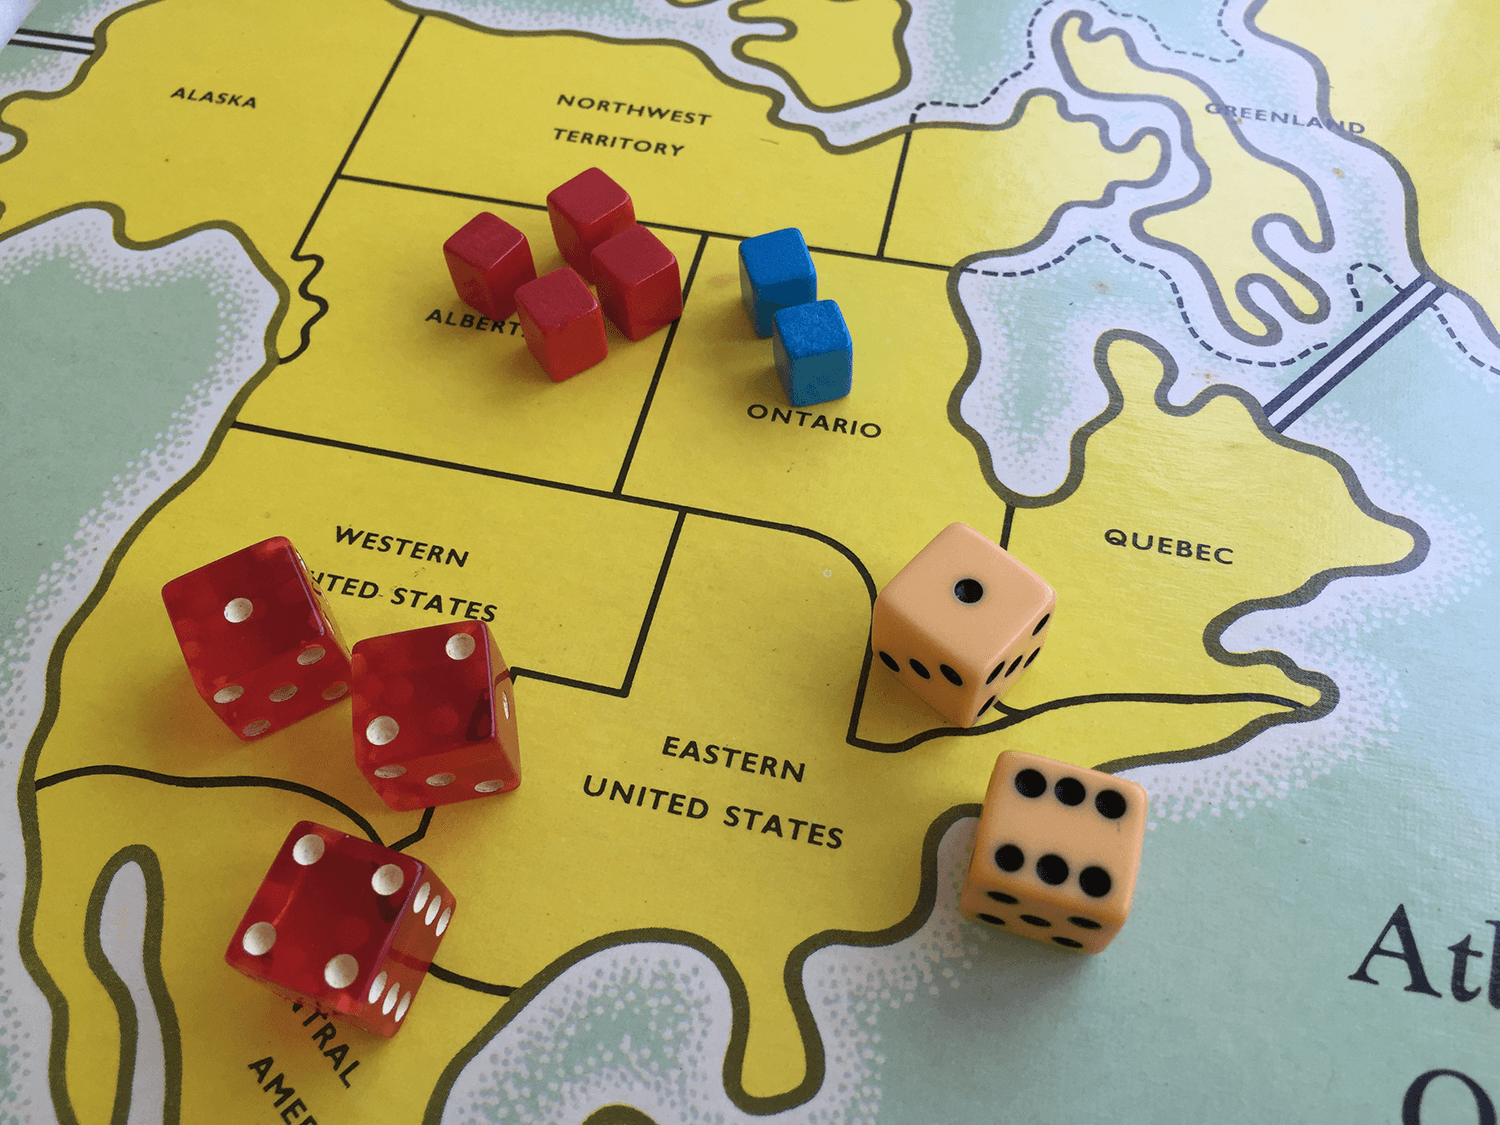
Here the red army in Alberta has four units that are attacking Ontario which is being defended by the two blue units. The attacker gets to roll all three red dice while the defender defends by rolling their two white dice. After the roll the highest numbers from each side are compared. The result is a win for the defender (6v4) and the red army loses one unit. The next highest dice scores are then compared. win for the attacker (2v1) so the blue army will lose one unit too.
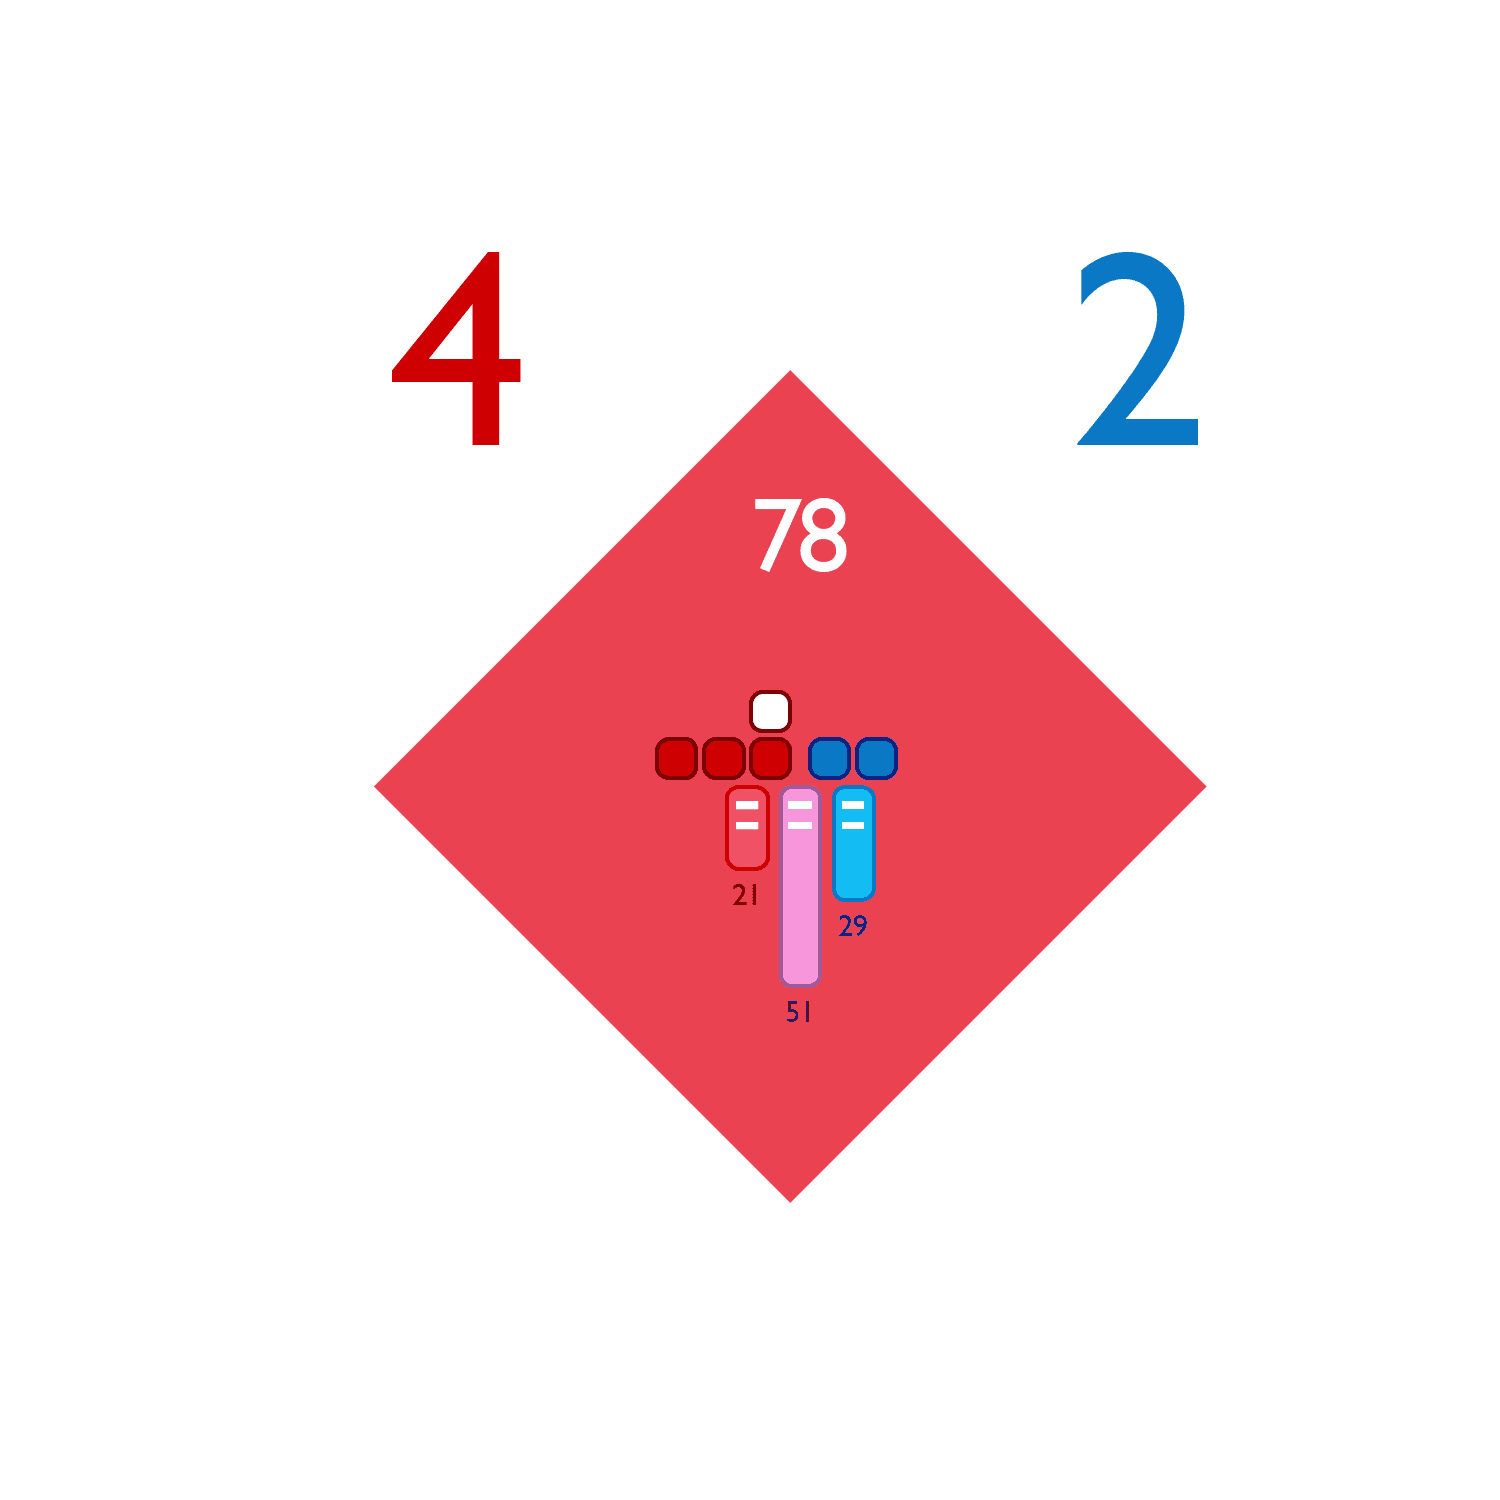
What were the odds of red capturing Ontario? The visualization shows that the odds in white at 78%. The red 4 is the number of attacking units and blue 2 is the number of defenders. The solid squares show the number of dice rolled by each player. The three bars show the odds for one set of rolls by both sides. Here there is a 21% chance that red will lose 2 units, 51% chance both will lose one unit and 29% chance that the blue defenders will lose 2 units. The territory could be captured in one roll but it may take two or more attempts.
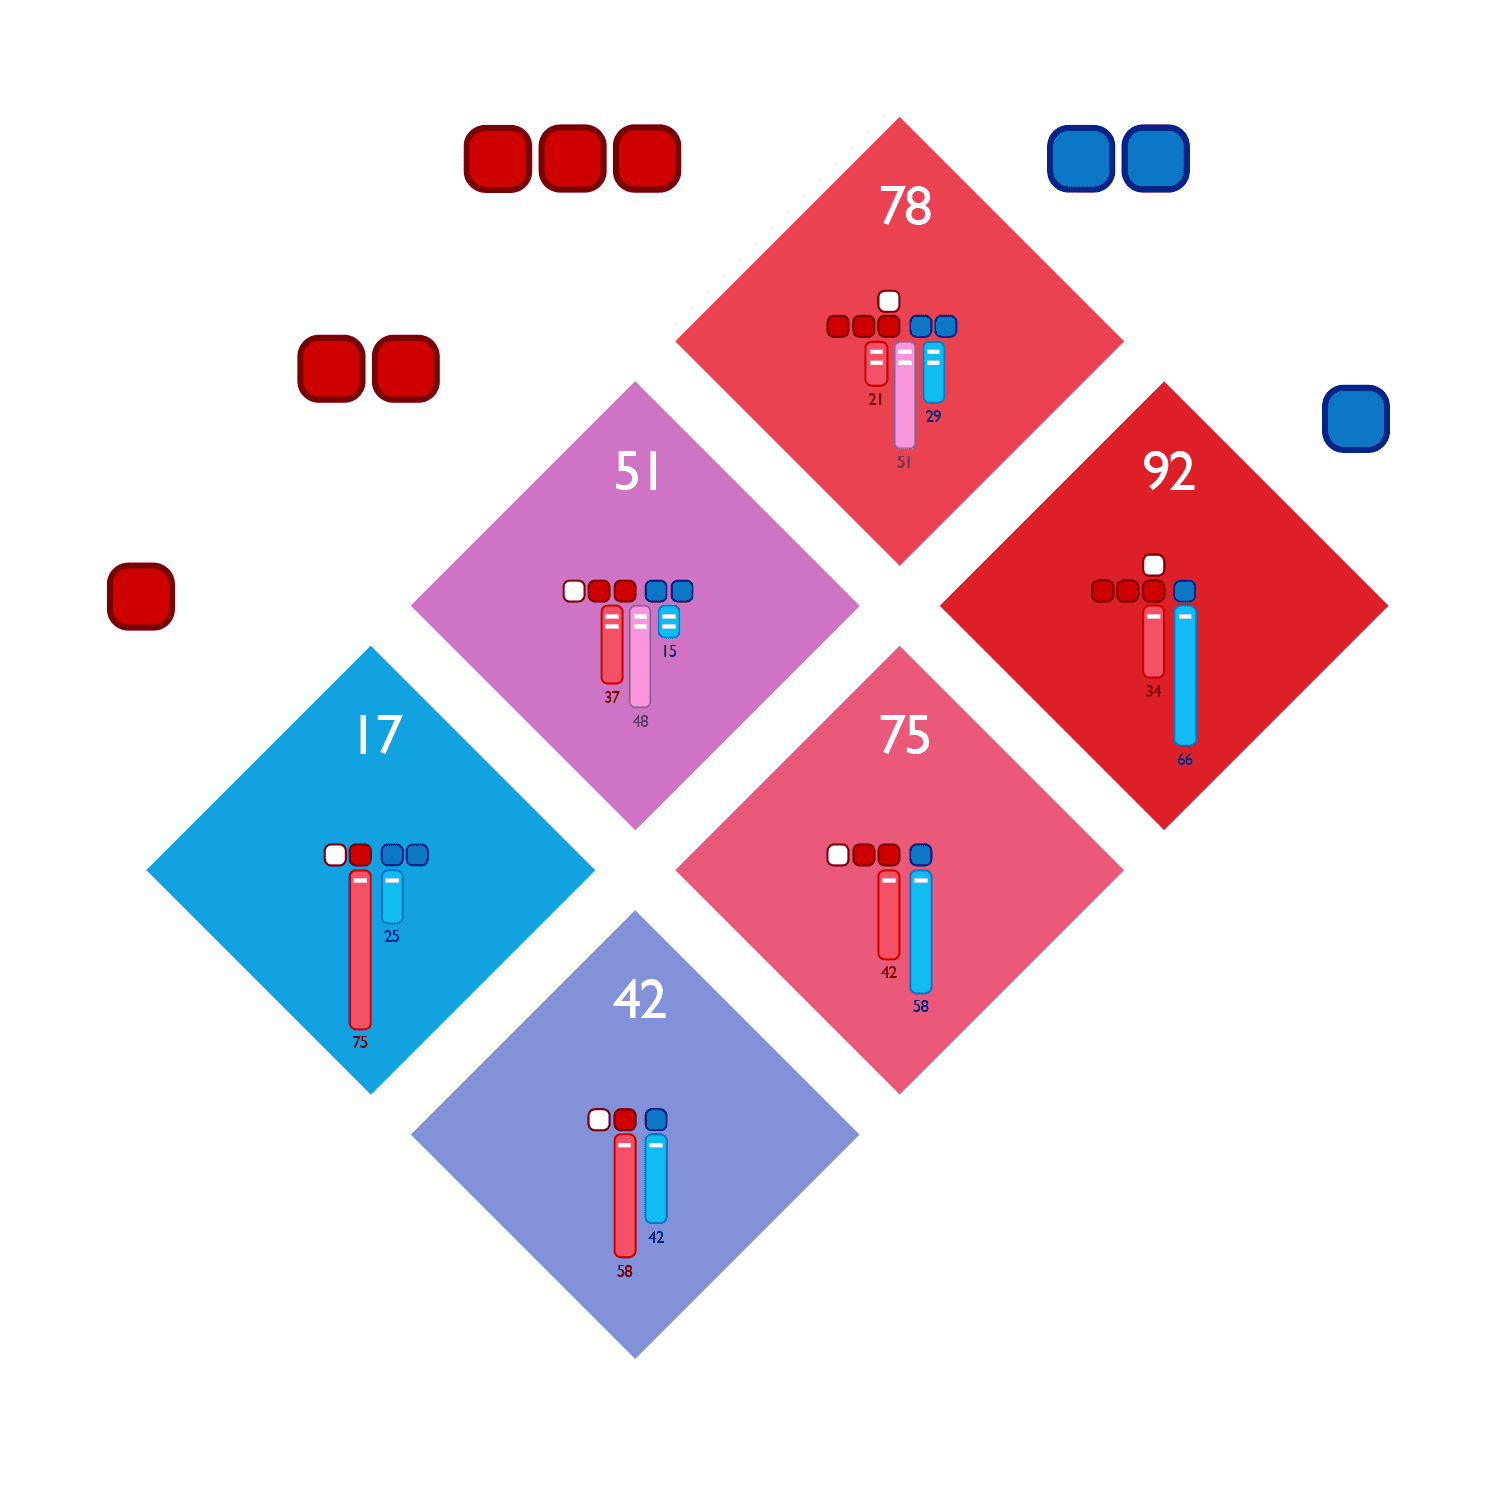
The odds for the six possible dice combinations (1v1, 1v2, 2v2, 2v1, 3v1, 3v2).
The open circle shows the selected message. The other blue highlighted messages and arcs show all the messages connected directly to the current selection. Dark blue messages are replies to the selection.
The white number at the top of each diamond shows the odds capturing a territory. This number also determines the color of the diamond, the redder the diamond the higher the odds of success. The bluer the diamond the more likely the attacker will fail.
Risk Viz
Visualizing the odds of capturing a territory in the classic board-game Risk.
Revealing your chances
Risk is a strategic game of world domination in which you pit your armies against your opponents in an effort to take over the globe. There is a simple set of rules that determines how to attack and capture territories, but what are the odds of success? This personal project set out to show the odds of capturing a territory given the number of attackers and defenders competing.
Red attacks blue
Depending on the size of their army, an attacker can choose to roll one, two or three dice (represented by the red rounded squares on the left). The red numbers running down the top left hand side show the number of units the attacker has in the battle; the blue numbers are for defenders.
Diamond details
The core of the visualization is made from a grid of diamonds. Looking closer, each diamond shows the number of attackers and defenders as small red, white or blue squares. The ones with red outlines are the attackers; the blue ones are the defenders. The solid squares reflect the number of dice that will be rolled by each player for that attack.
Percentage odds
The white number at the top of each diamond gives the attacker his percentage chance of success if he keeps attacking until he successfully captures the territory. This number determines the color of the diamond too. The more red the diamond is, the more likely the attacker is going to win; the more blue the diamond, the less likely the attacker will succeed. If the diamond is purple, then the chances are more even.
Six clusters
In addition, the diamond grid is split into six clusters. Each cluster has the same odds for a single attack roll because there are only six possible dice combinations (1v1, 1v2, 2v2, 2v1, 3v1, 3v2). The lowest diamond in each cluster shows these odds in two or three vertical bars. The red bar indicates the percentage chance of the attacker losing units. The blue bar indicates the percentage chance of a defender losing units, and the purple bar shows the chance that both attacker and defender will lose one unit. The number of units lost are indicated by the “-“ sign that is overlaid on each bar (either one or two units).This visualization was built primarily programmatically inside Adobe Illustrator using Illustrator scripting.