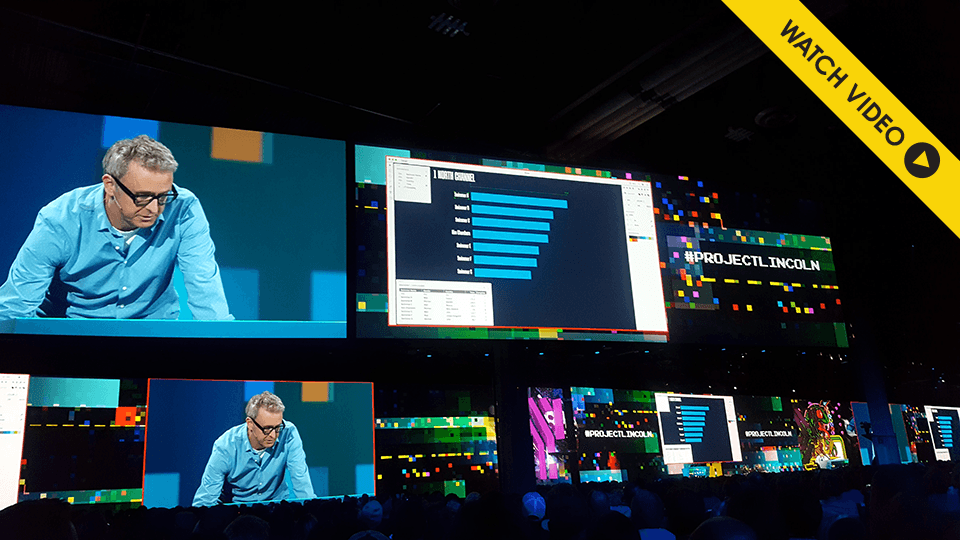

Lincoln sets out to help people tell stories with data. This first Lincoln prototype was demoed in front 12,000 Adobe fans as a Sneak at Adobe MAX 2017. Video [6:18mins]
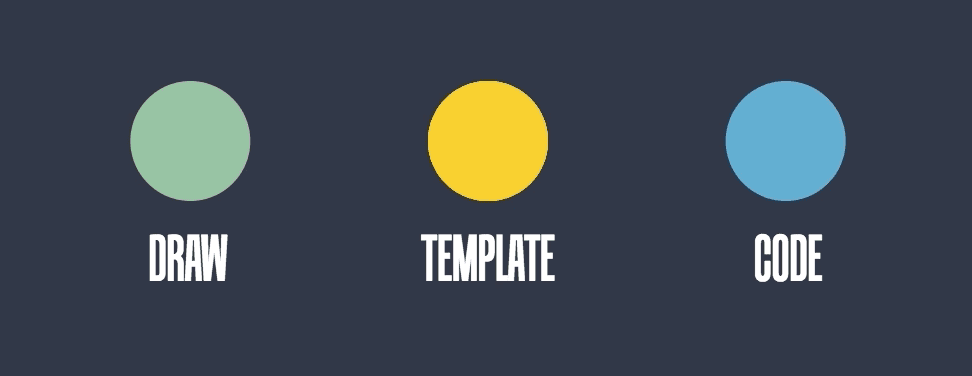
Traditionally, there are three approaches to making data visualizations: Draw something from scratch, use a Template, or do it with Code. Drawing is slow and tedious, it’s easy to make mistakes and if your data changes you have to start all over again. Templates are never quite what you want and it’s always hard to make adjustments. And, coding is a difficult skill to learn so it is too complex for most people.

The fundamental concept of Lincoln is to sketch first and then bind your data. This means that any of the properties of a graphic element such as position, size, color or text can be bound to data.
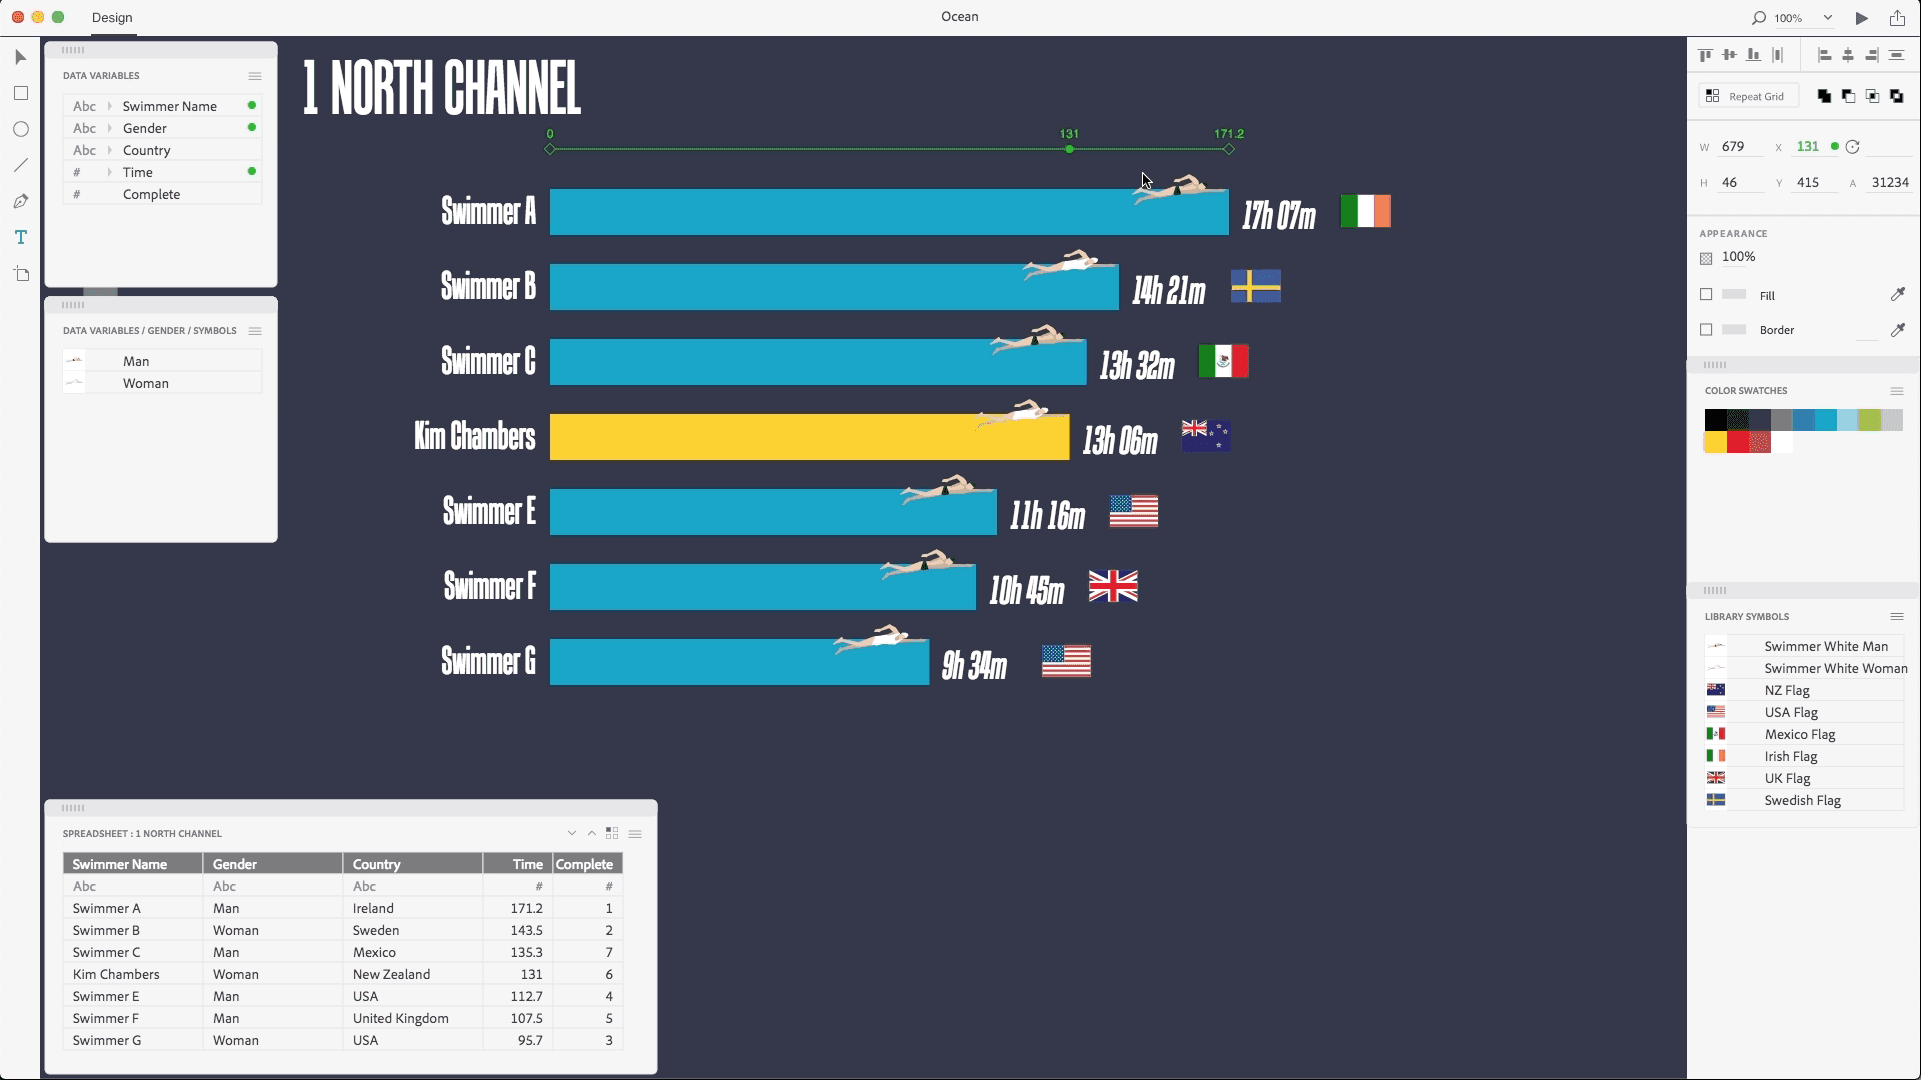
This early prototype (demoed at Adobe MAX 2017) shows the fundamentals of how Lincoln works. It looks and feels like any modern design tool, but it has superpowers that have never existed before. Spreadsheet data can be used to set properties such as color, scale or position of any graphical element.
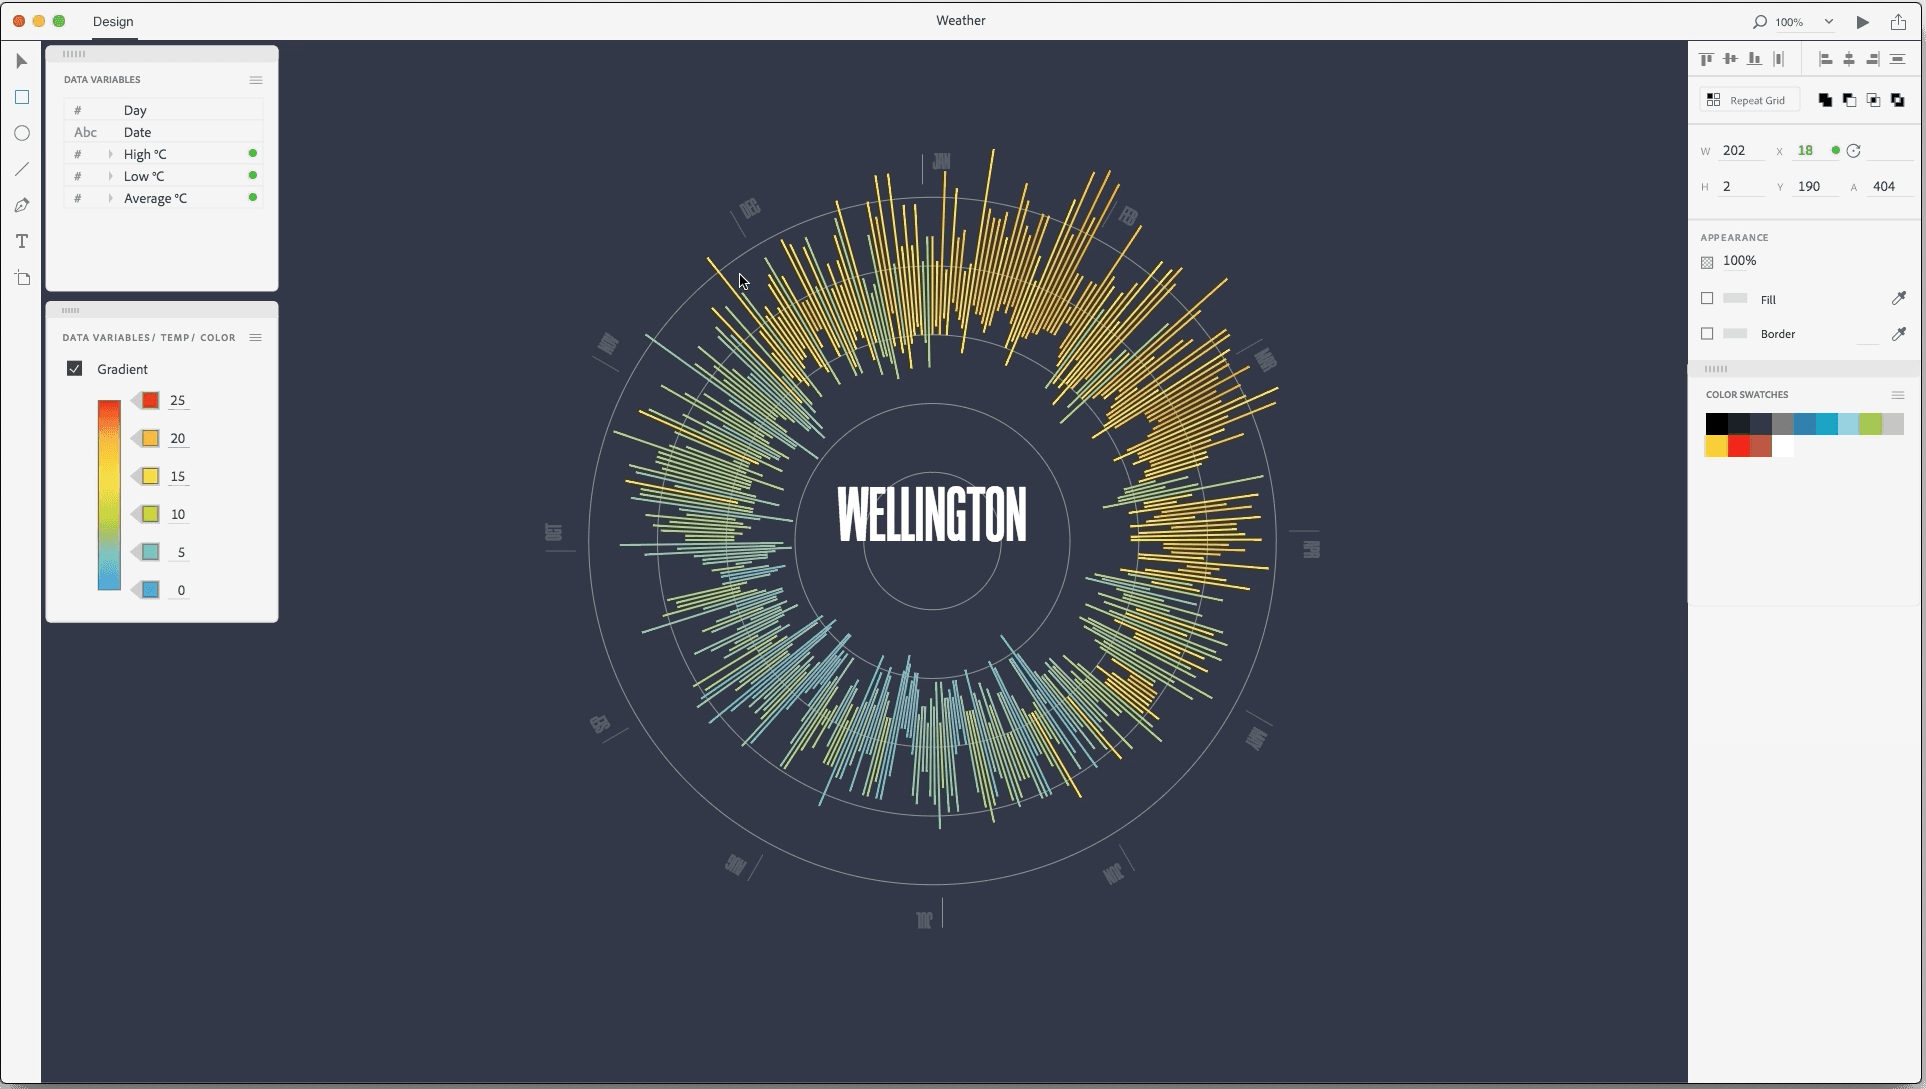
In this example, Lincoln lets you bind data to the color properties of a rectangle. The data-driven color picker lets you assign colors to a continuous range of data. Lincoln also lets you lay out objects in polar space to create compelling visualizations like this Weather Radial.
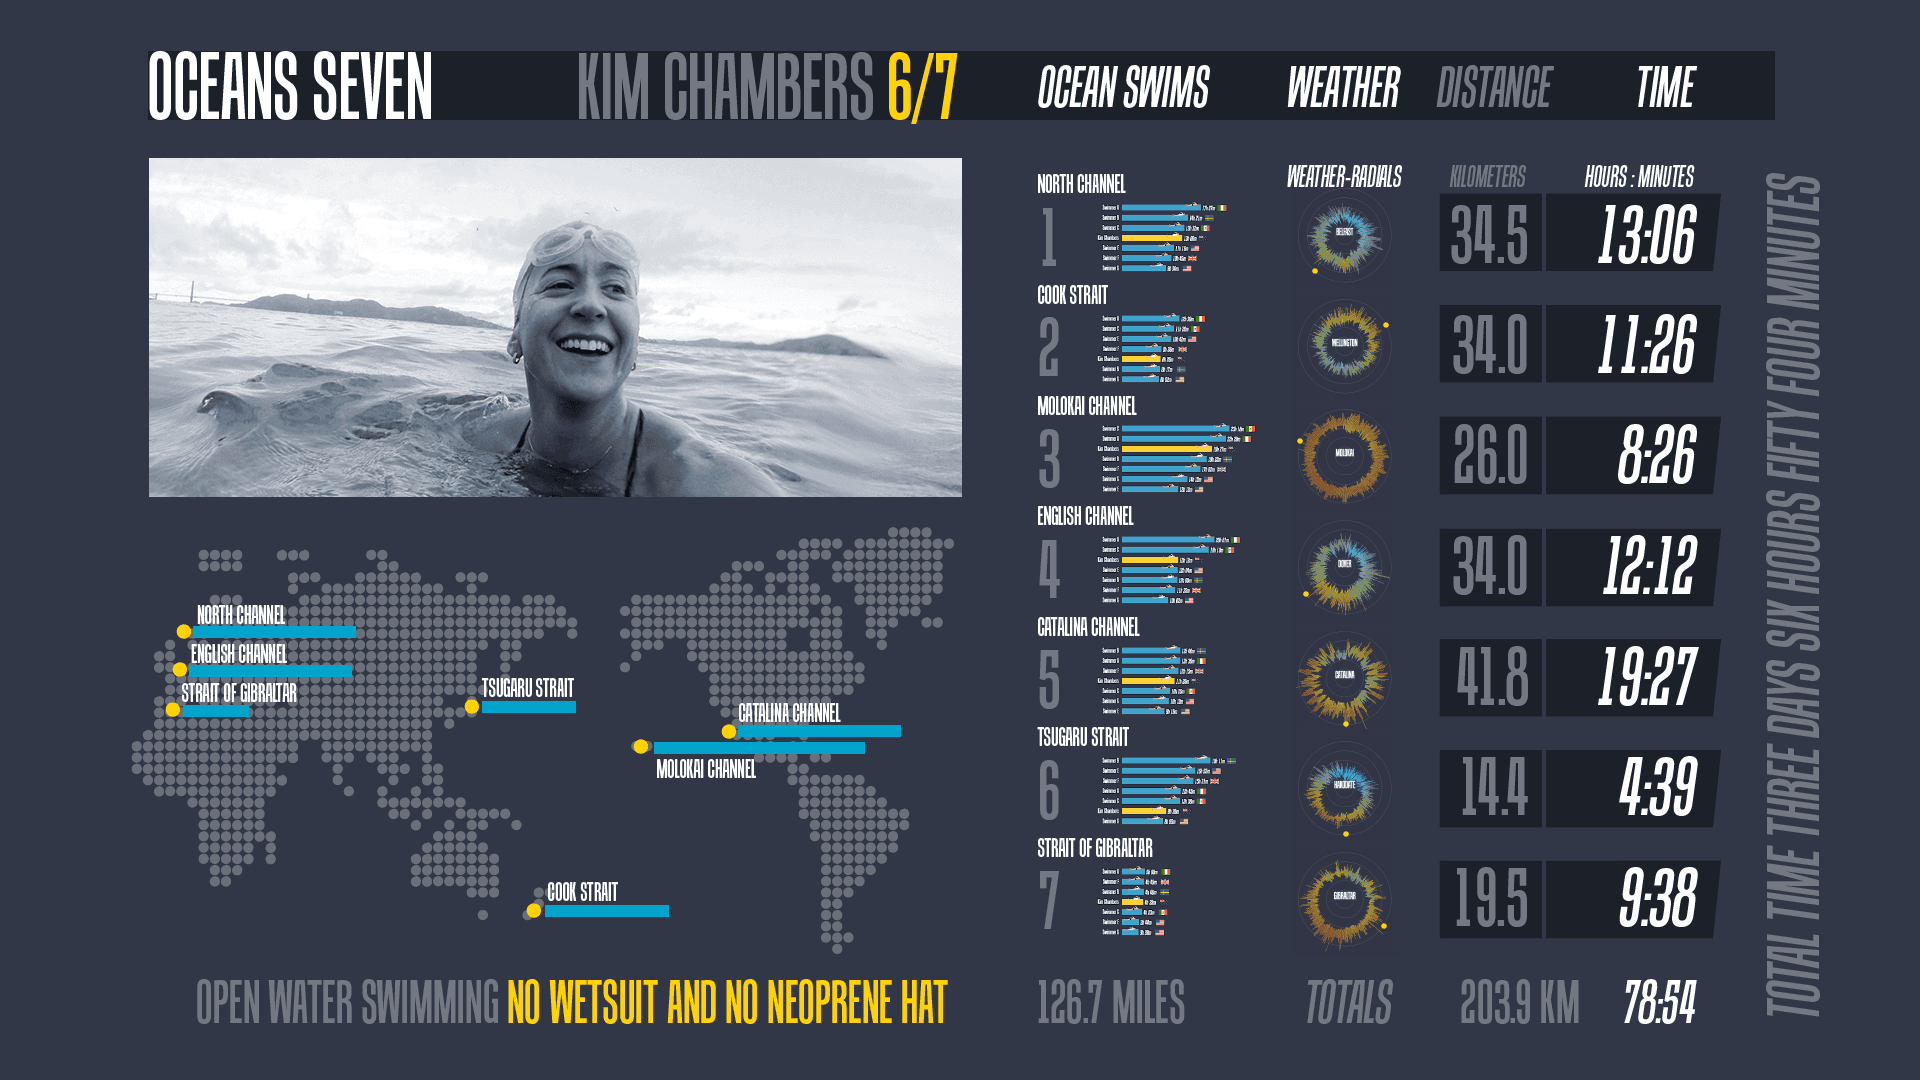
Lincoln is lightning fast. All of the charts for this poster were created in less than 4 minutes onstage at Adobe Max.
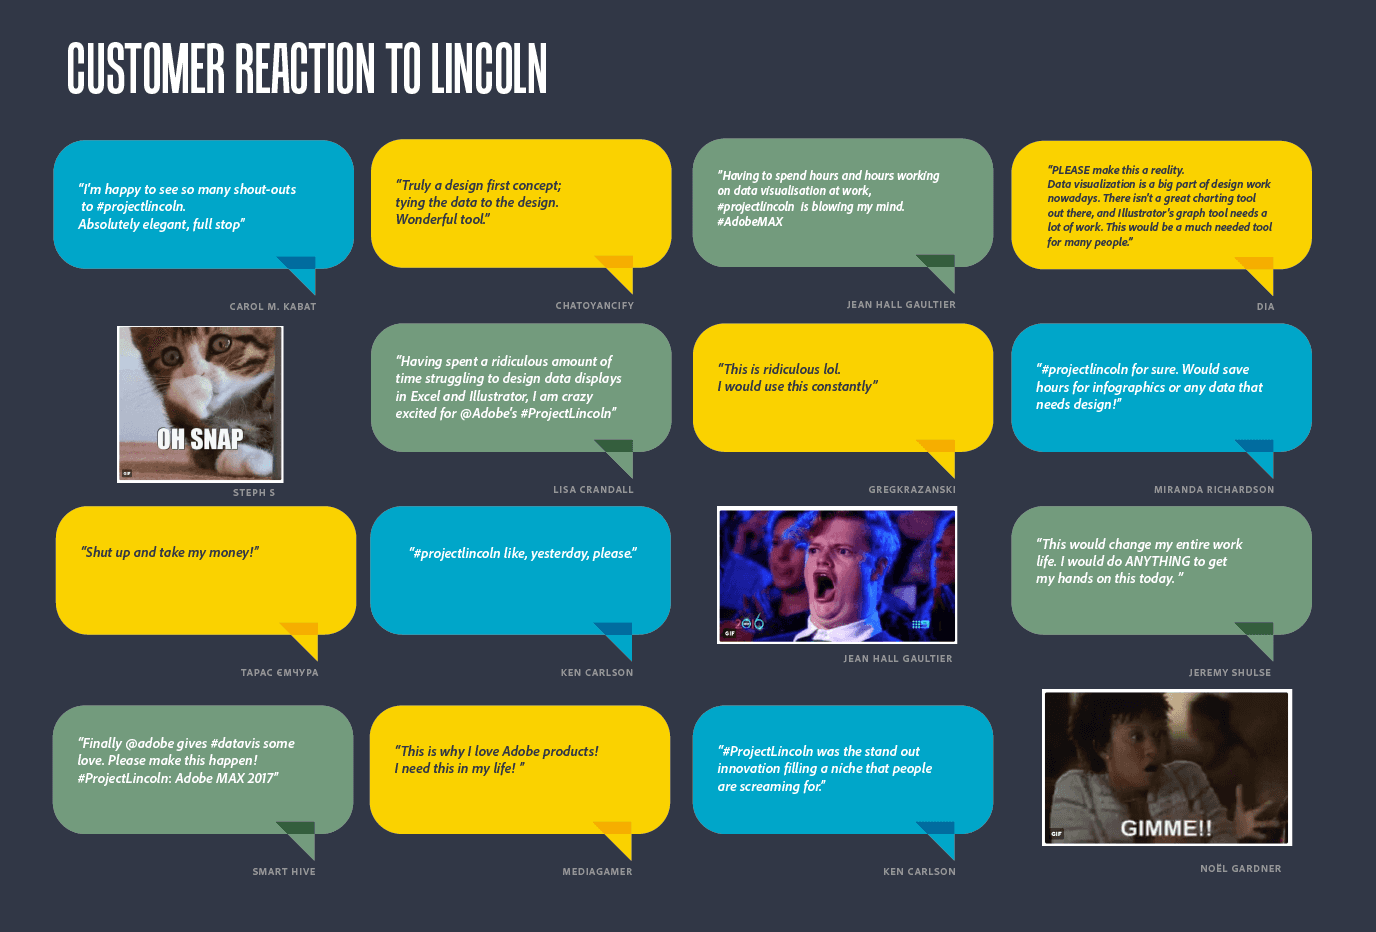
The universal reaction from everyone who saw Lincoln was “Wow! This is great. When can I have that?” And “How can I help get this made?”
Lincoln - Data viz tool
A revolutionary new approach to data visualization using data-driven design tools to create stories with numbers.
Data as a design material
Lincoln treats data as a new design material that not only changes the way data visualization, charts, graphs and infographics are made, but it also changes the way people design with digital tools.
Chief Instigator
Initiated project and owned the product vision. Designed from top to tail: made strategic case, conducted customer interviews, did competitive research and invented new tools and interactions. Multiple prototypes were built to discover and refine new interaction patterns. Collaborated with Adobe Research to develop the underlying tech needed power these tools. Assembled a team of extraordinarily talented prototyping engineers to build a fully functional prototype that was tested and iterated on with customers.
Fluid templates
Lincoln’s combination of tools are powerful, fast and flexible enough for people of all skill levels to build basic and novel visualizations at lighting speeds with ease. Any visualization, chart or infographic can be saved as a data-driven template making Lincoln approachable from either a blank canvas or an existing template. Unlike traditional templates, Lincoln’s templates can be edited and remixed with the same set of design tools used to create them. As a result, an enterprise design team can create a set of templates with specific fonts, colors and spacing that can be used by their entire organization.
Charts and figures in the wild
During its development, Lincoln was used to create visualizations, charts and figures for peer-reviewed scientific papers and presentations. This gave us the opportunity to test all of Lincoln’s design tools and workflows. Some examples of these visualizations are here.
© Bernard Kerr, 2023. No part of this site, bernardkerr.com, may be reproduced in whole or in part in any manner without the permission of the copyright owner.